Charting
The backtester supports several different charting tools all found in the Balsam.Charting namespace. The simplest of these is the Chart() extension method which can be called directly on any object that implements the ISeries interface (TimeSeries, BarSeries, etc.) as well as on strategies.
Plot instructions
On the prior page we added plot instructions to OnStrategyStart() (reproduced below.) The first call plots the short-term SMA in pane 0, by convention the main price pane. The second call plots the long term SMA also in the main pane. The final call takes advantage of a built-in PlotInstruction constant to plot stops that were assigned to a position in OnPositionOpening().
protected override void OnStrategyStart()
{
    Col1 = Sma(Close, ShortLength);
    Col2 = Sma(Close, LongLength);
    Col3 = Atr(21);

    Plot(Col1, 0, Color.Blue);
    Plot(Col2, 0, Color.Red);
    Plot(PlotInstruction.PlotStops);
}
If we run the strategy on a symbol and call Chart() we will see something similar to this:
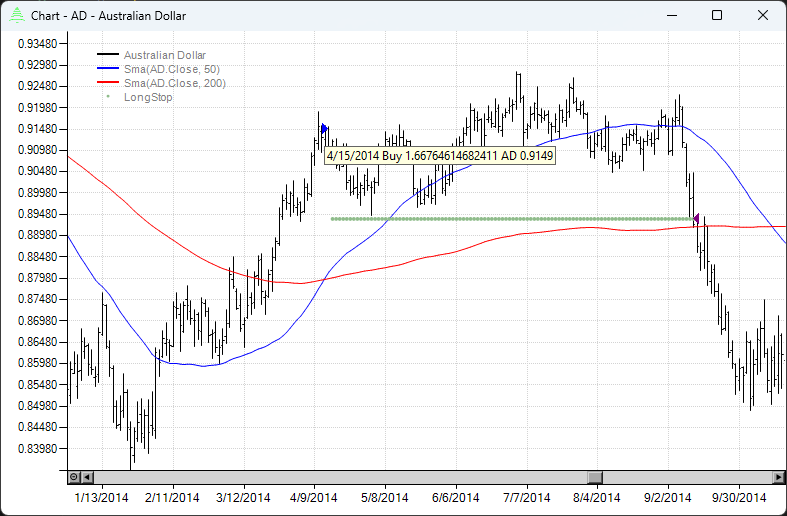
The 50 period SMA is in blue, the 200 period is in red and the protective stop is shown by the green dots. Long entries are denoted by a right facing blue triangle (short entries are red) while exits are denoted by a left facing purple triangle. You can see at a glance that this trade was exited on the stop well before the moving averages crossed. If you hover your mouse over the buy/sell markers, a tooltip will pop up showing relevant information about the trade. You can use the mouse to zoom in and the escape key to zoom back out. Right clicking on the chart will bring up other options including a data window with crosshairs, the ability to copy to the clipboard, change the chart scaling, etc.
Let's say we wanted to add an indicator to a new pane. Below we add a 10 period raw Stochastic indicator and set the pane size to one third of the total vertical area.
Plot(Stochastic(10), 1, Color.Purple, paneSize: 33f);
If we re-run the strategy and call Chart() we'll see a new pane has been added and sized appropriately.

Tip
If you are using the .NET Framework 4.7.2 dlls and see error messages like "The type 'Chart' is defined in an assembly that is not referenced" you will need to add references to the System.Drawing, Windows.Forms and Windows.Forms.DataVisualization assemblies. See the Installation page for more details.
Advanced charting
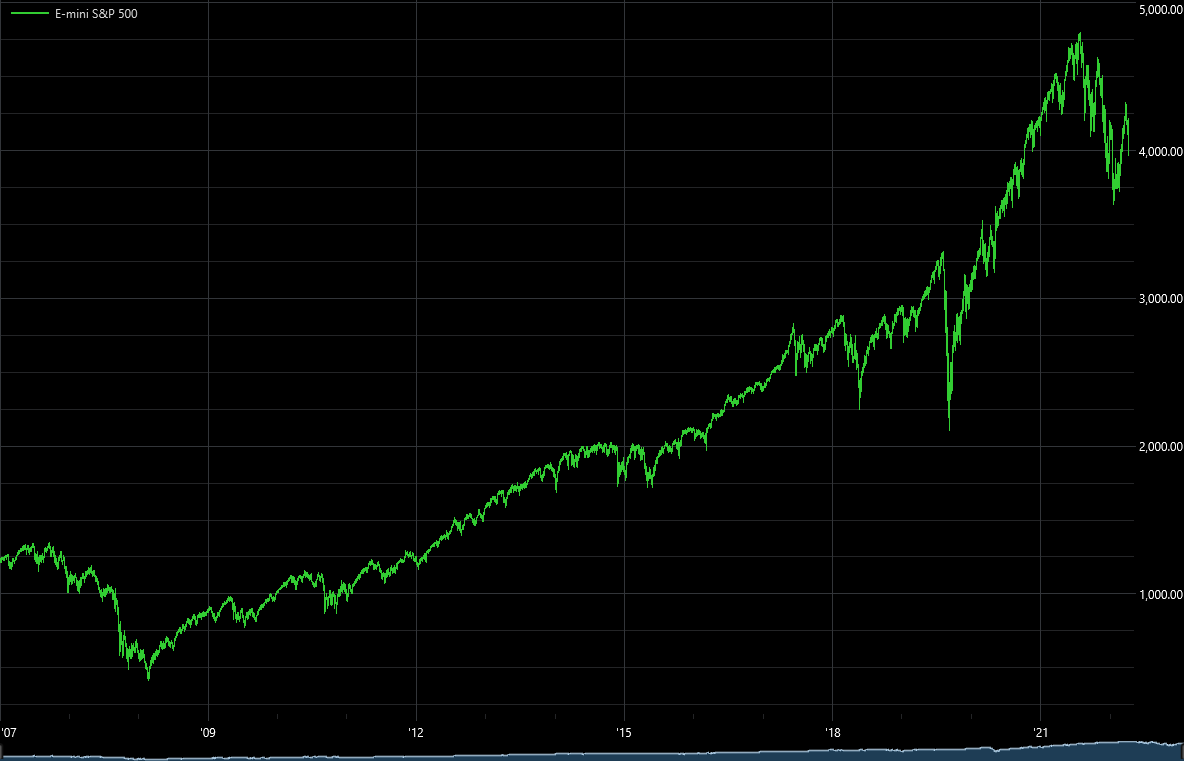
The charting code discussed above leverages the data visualization classes built-in to the .NET framework. When working with daily data or small amounts of intraday data, say hourly bars or above, the performance is fine; however, for large amounts of higher frequency data like 1 minute bars, the advanced charting component is required. These charts can display very large amounts of data with unlimited zoom capabilities. For example, the chart below is comprised of approximately 5.5 million one minute bars. To create charts with this tool, call the Chart2() extension method on your strategy.
Note
The advanced charting component requires your code to be run without the debugger attached (Ctrl+F5 in Visual Studio).