Create stand-alone charts
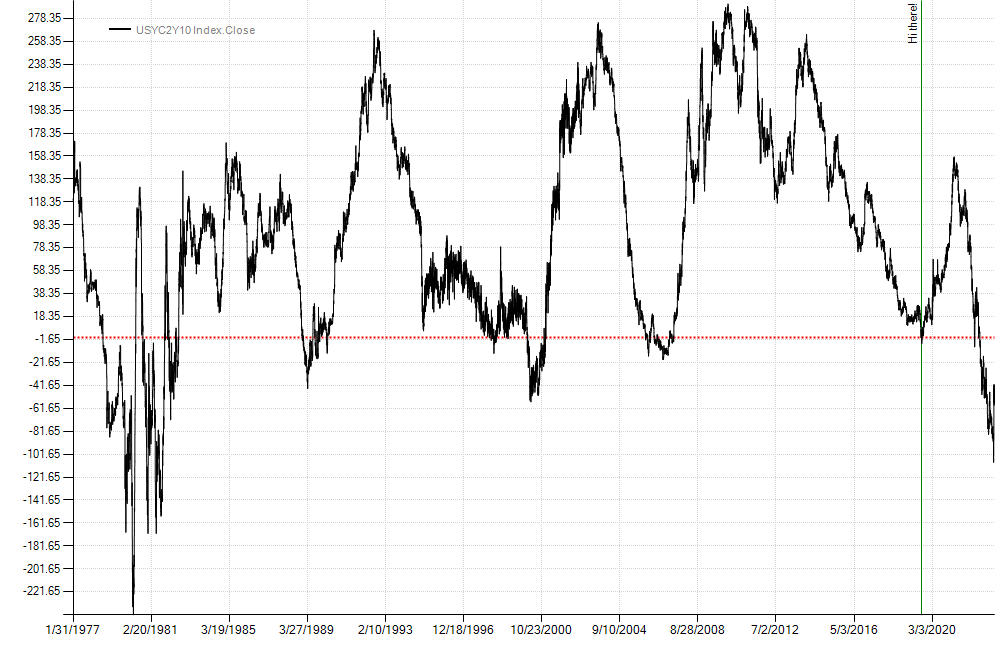
Sometimes it's helpful to create charts independent of a strategy. This can be done by passing plot instructions to the Chart class using the Plot() method. Then create a ChartForm (found in the System.Windows.Forms namespace) as a container for the chart and call ShowDialog() to display it. You can also save charts directly to an image file. Below we plot the 2-10 yield curve along with a horizontal line on the y-axis and a vertical line on the x-axis. We save the chart to a file before displaying it.
var twoTen = BarSeries.Load(@"c:\data\temp\USYC2Y10 Index.csv").Close;
var cht = new Chart();
cht.Plot(new PlotInstruction { Series = twoTen },
    new PlotInstruction { YValue = 0, Color = Color.Red, LineStyle = "Dot", Width = 2 },
    new PlotInstruction { XValue = new DateTime(2019, 8, 27), Color = Color.Green, Text = "Hi there!" });
cht.SaveImage(@"c:\temp\myChart.png", ChartImageFormat.Png);
new ChartForm(cht).ShowDialog();