Data
Data is the lifeblood of any quantitative or systematic strategy. Before we can do any testing, we need to get data into the system. But first, there are a few foundational classes you will need to understand.
TimeSeries
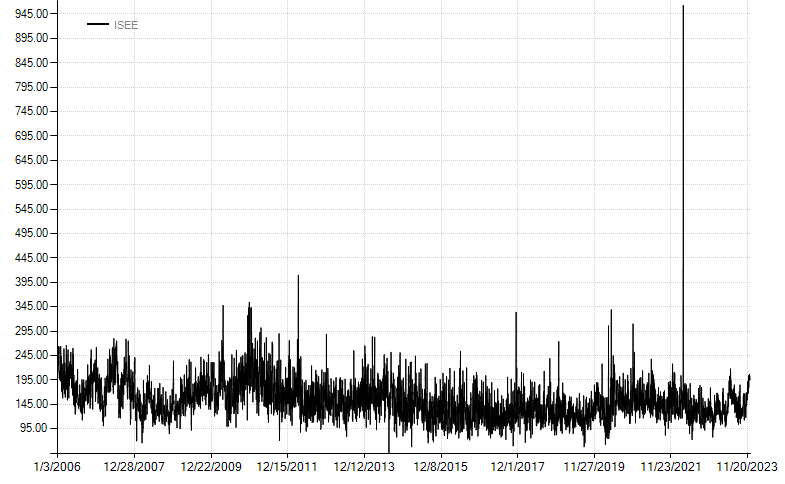
TimeSeries encapsulate an array of numeric values as well as their associated dates. In fact, TimeSeries act just like arrays in other programming languages so you can reference values via an indexer like [0]. Typically you won't create a TimeSeries directly. Rather, you will load data from a file or call an indicator calculation that will return a TimeSeries object instead. For example, loading a csv file with date, observation is as simple as calling:
var ts = TimeSeries.Load(@"c:\data\ISEE.csv");
You can then examine several properties of interest:
ts.Count //number of observations
ts.FirstDate //first date in the series
ts.LastDate //last date in the series
ts.Symbol //symbol inferred from the filename
As well as visualize the data by calling the Chart() extension method like so:
ts.Chart();
Bars, BarSeries and BarSeriesCollections
The next foundational class is a Bar. The standard Bar class contains Date, Open, High, Low, Close, Volume, OpenInterest, and UnadjustedClose properties. The Bar class is also naturally extensible so additional fields can be included beyond the defaults. For example, you could load the S&P 500 OHLC (open, high, low, close) and also include the dividend yield as an extended property.
Like TimeSeries, we typically won't create bars directly, but rather will load them from a data source. A single bar in isolation is of little use, so we will be working with BarSeries, a collection of bars ordered by date. Along with TimeSeries, BarSeries are one of the most commonly used data classes. Backtests are run on BarSeries. Just like a TimeSeries, you can load BarSeries directly from a text file:
var data = BarSeries.Load(@"c:\data\BCOM Index.csv");

//you can enumerate bars
foreach (var bar in data.Take(10))
{
    Console.WriteLine(bar);
}

//or get a TimeSeries of just the bar's closing prices
var close = data.Close;
//and of course you can chart a BarSeries as well
data.Chart();
Other series
BooleanSeriescontain true/false values and is commonly used to indicate a distinct event, for example when an indicator value crosses above a certain level.IntegerSerieswork just likeTimeSeriesbut store integer values instead of floating point double values.DateSeriesencapsulate a list of dates only. This can be useful in backtesting for keeping track of dates that correspond to events like FOMC announcements or economic releases.
BarServers
It's tedious to specify a filename to load data so we usually rely on a BarServer to return a BarSeries. By using a BarServer we only have to specify the directory once and then we can load BarSeries by symbol. The backtester has quite a few bar servers built in or you can build your own by implementing the IBarServer interface. Built-in bar servers can be found in the Balsam.DataServers namespace. A few of the most commonly used include:
ASCII BarServer
One the simplest is the AsciiBarServer, which as the name implies, loads ASCII or plain text files. It can be used on its own or it can be extended to provide additional functionality like the CsiBarServer we cover next. Rather than calling BarSeries.Load() and passing in a filename, typically you would do something like this:
 var server = new AsciiBarServer(@"c:\data\temp");
 var bcom = server.LoadSymbol("BCOM Index");
 var data = server.LoadAll();
- In line 1, we create a new
AsciiBarServerfor data found in the C:\data\temp directory. The file format will be inferred automatically since we are using a common format (DOHLC in this case). Additional overloads to the constructor allow you to specify the file extension, delimiter (comma, tab, etc) as well as the file layout. - In line 2,
LoadSymbol()returns aBarSeriesfor the BCOM index. - In line 3, the call to
LoadAll()returns all the data in the specified directory as aBarSeriesCollection. As its name implies, aBarSeriesCollectionis a collection of one or moreBarSeries. It can be indexed by ordinal position within the collection (.e.gdata[0]) or by symbol (e.g.data["BCOM Index"]).BarSeriesCollectionsare useful for portfolio testing where we run a backtest across multiple symbols simultaneously.
CSI BarServer
Futures traders usually do research on backadjusted contracts. One of the commonly used end-of-day data providers is CSI. Their Unfair Advantage software can output files in a variety of formats but ASCII is unbeatable for its simplicity and iteroperability. The backtester has a specialized AsciiBarServer designed to read CSI files. By convention, backadjusted files should be output using the following CSI format: DOHLCVINU, which is code for:
- Date
- Open
- High
- Low
- Volume
- Open interest
- Delivery code
- Unadjusted close
When output in this format, the data looks like this:
19840912,661.80,662.75,661.45,662.55,48784,30954,198409,165.30
19840913,663.07,666.70,661.85,666.55,73097,33148,198409,169.30
19840914,667.35,668.25,665.95,666.40,73752,33567,198409,169.15
19840917,666.60,667.35,665.60,666.55,64273,37035,198412,173.00
19840918,666.35,667.05,665.55,666.15,63664,37881,198412,172.60
19840919,665.90,668.00,663.90,664.25,76249,39614,198412,170.70
19840920,664.60,665.40,664.00,665.10,48619,39331,198412,171.55
In this example we can see there was a roll from the Sep contract (delivery code 198409) to the Dec contract (delivery code 198412) on 9/17/1984. Also note the unadjusted close on September 17th is 173 versus 666.55 for the backajusted close. The unadjusted close contains the price that existed at that point in time before the cumulative effects of backadjusting. Having the unadjusted close is critical for calculating accurate percentage changes. One common mistake is calculating percentage changes directly on backadjusted prices. It's rarely correct and is sometimes wildly off. The correct calculation for the percent change on 9/17/1984 is the point change divided by the unadjusted close from the prior day:
- (666.55 - 666.40) / 169.15 = 0.000887
not
- 666.55 / 666.40 - 1 = 0.000225
Note the 4x difference versus the naive calculation using backadjusted prices only. The backtester automatically uses the unadjusted close as the denominator whenever appropriate.
Binary BarServer
The BinaryBarServer reads data stored in a custom binary format. Binary tends to be much quicker to load at the expense of not being able to view or edit the data with a text editor or Excel. But when working with large amounts of intraday data, the time savings from using a binary format become significant. In the simple benchmark below, we load approximately 13 years of one minute intraday data containing ~4.8 million bars. On a modern machine with a NVMe SSD drive, the ASCII data loads in about 7.5 seconds. That same data stored in a binary file loads in just over a second.
internal class Program
{
    static void Main(string[] args)
    {
        IBarServer server = new AsciiBarServer(@"c:\data\intraday\continuous");
        var sw = Stopwatch.StartNew();
        var data = server.LoadSymbol("@ES");
        sw.Stop();
        Console.WriteLine($"{data.Count:N0} ascii bars loaded in {sw.Elapsed}.");

        data.Save(@"c:\data\temp\@ES.bin", PersistenceFormat.Binary);
        server = new BinaryBarServer(@"c:\data\temp");
        sw = Stopwatch.StartNew();
        data = server.LoadSymbol("@ES");
        sw.Stop();
        Console.WriteLine($"{data.Count:N0} binary bars loaded in {sw.Elapsed}.");
        Console.ReadLine();
    }
}
4,769,984 ascii bars loaded in 00:00:07.6500165.
4,769,984 binary bars loaded in 00:00:01.1827305.
Other BarServers
Tiingois an excellent free or inexpensive data source for equities. Visit Tiingo to register and get a personal API key.TradeStationBarServeris a specializedAsciiBarServerfor reading data exported from a TradeStation Data Window.FREDServerallows retrieval of many economic series, including point-in-time data, from the St. Louis Federal Reserve's excellent FRED service. Register for a free API key.BloombergBarServerinterfaces directly with Bloomberg to retrieve data via the Desktop API. Licensed as a separate entitlement from the core backtester.UnfairAdvantageinterfaces directly to CSI's Unfair Advantage via their API. Requires an API entitlement from CSI. Licensed as a separate entitlement from the core backtester.IBarServerbuild your own bar server by implementing this simple interface.